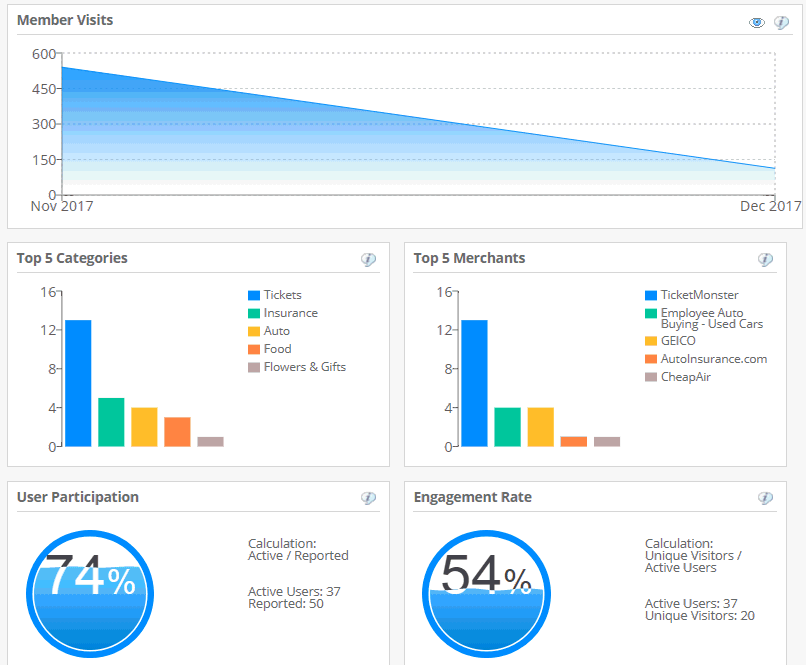
The Main Overview dashboard provides an at a glace look at Member Visits, Top 5 Categories, Top 5 Merchants, User Participation and Engagement Rate.

Click the chart information icon to learn more about the chart.

Click the eye icon for report viewing options.
Member Visits - This chart shows total member visits over a specified date range. If you hover over the chart near the start date of the time period, that value as of that date displays. If you hover near the end date of the time period, that value displays.
Top 5 Categories - This chart shows the top five visited categories, such as Travel, for your site during the selected date range. Hover over the bar to view the Category information.
Top 5 Merchants - This chart show the top five merchants visited for your site during the selected date range. Hover over the bar to view the Merchant information.
User Participation - This chart shows your percentage of user participation during the selected date range based on the number of active users divided by reported users.
Engagement Rate - This chart shows your percentage of user engagement during the selected date range based on the number of unique visitors in the last 30 days divided by the number of active users in the last year.